


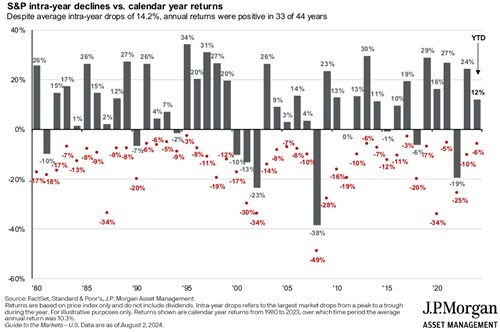
If you’ve noticed some recent market volatility, you’re not alone. The S&P 500 reached an all-time high on July 16 but then dropped by 8.5% over the next 14 trading days before starting to recover on August 5. As of the close on August 20, the market is down just 1.29% from its peak.
While this may have felt dramatic at the moment, an 8.5% decline isn’t out of the ordinary. The S&P 500 typically experiences at least one 5% correction each year. Since 1980, the index has averaged an annual decline of 14.2%, yet it has also delivered an average total return of 10.3% per year.
A few things to keep in mind:
- Historically, the fourth quarter tends to be the strongest for stock performance.
- August and September are typically the weakest months of the year.
- Election years are generally more volatile, particularly in the weeks leading up to the election.
- However, election years also tend to be favorable for investment returns.
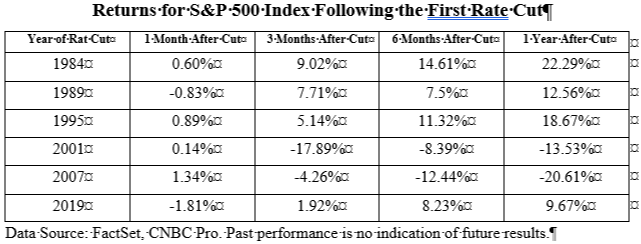
Historically, markets have responded positively to Fed rate cuts. The table above shows strong market performance following rate cuts in 1984, 1989, 1995, and 2019. However, markets performed poorly after rate cuts in 2001 and 2007, but in both instances, the economy was on the brink of a recession.
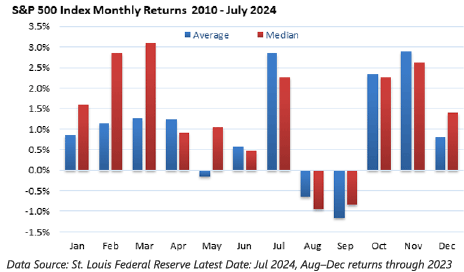
Monthly data indicates that August and September are historically the weakest months for market performance. Since 2010, these two months have ended in the red 8 out of 14 times.
- August has averaged a decline of 3.47%.
- September has averaged a decline of 4.3%.
Unemployment is rising, but still quite moderate.
Unemployment rose to 4.3% in July.
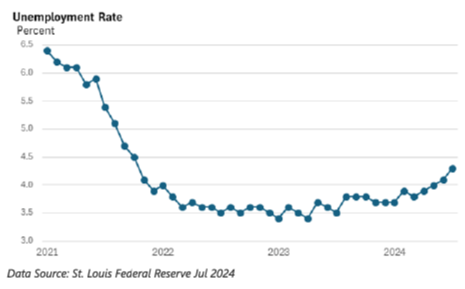
By historical standards, current unemployment rates are relatively moderate. Here are some key points about unemployment over time:
- The Great Depression was exceptionally severe, with unemployment reaching 24.9% in 1933, the highest rate since the Bureau of Labor Statistics (BLS) began collecting data.
- In the 1980s, unemployment peaked at 9.7%.
- During the Great Recession, unemployment rose to 9.6% in 2010.
- In April 2020, amidst the COVID-19 pandemic, unemployment surged to 14.9%.
Given these fluctuations, it’s understandable that markets may experience volatility. However, for long-term goals, there is still no better tool to grow your wealth than investing in quality U.S. companies. If you’d like to discuss your financial goals and how to navigate market fluctuations, I would be honored to meet with you. I am an experienced, highly-trained, CERTIFIED FINANCIAL PLANNER™ professional and Behavioral Financial Advisor in West Saint Paul, Minnesota. Just follow this LINK to find a time for us to have a get-acquainted visit.
I am a financial planner who is an advocate for my clients ALL THE TIME – a fiduciary financial planner. I provide guidance based on clients’ best interests, not commissions or sales quotas. I think it’s the best way to serve clients and I am thrilled to work this way all the time.
And yes, I’m still taking on a few great families to be part of my financial planning practice in West Saint Paul, Minnesota and, thanks to Zoom, across the country.
Dunncreek Advisors does not provide legal or tax advice, nor is this article intended to do so.